Have you heard about Power BI Visual Calculations? This is a powerful feature that streamlines on-the-go analysis directly within visuals. No need to write complex DAX or create separate measures! You can understand this 2025 update through Power BI training with Lumify Work.

In my decades of experience in ICT training, software development, operations and banking, I've found that Power BI has been valuable in offering timely and insightful reports. Power BI Visual Calculations takes this further.
What is the New Visual Calculation Feature in Power BI?
The new calculation feature allows users to perform dynamic calculations directly within visuals, without needing to write complex DAX formulas or modify the underlying data model. This marks a shift toward more intuitive, visual-first analytics.
Who benefits from Power BI Visual Calculations?
Whether in sales, marketing, operations, support or leadership, you can build reports where time-based or comparative metrics are often used. And no matter your industry (banking, education, telecoms etc.), you can benefit from Visual Calculations and Power BI training.
Business Analysts - Visual Calculations lets you apply logic like running totals or rankings directly in the visual. You can also create Power BI visual calculations per centage reports. This speeds up comparisons, trend analysis and storytelling.
Data Analysts - Test hypotheses and build calculations in context, while reducing the overhead of managing a large measure table. This helps create dynamic benchmarks or conditional formatting rules based on visual-level logic.
BI Developers - Prototype dashboards faster and reduce clutter in the data model. It’s ideal for ad-hoc analysis, too. It supports implementing client-specific KPIs that vary by visual without bloating the model with dozens of measures.
Decision Makers - Those reporting to stakeholders can highlight visual insights over technical formulas. Decision makers can interact with data more intuitively, without needing deep DAX knowledge. They can quickly toggle between different performance metrics during a live review session.
Reporting helps everyone keep track of their performance. Regardless of your role, Power Bi Visual Calculations can make a positive impact on how you work.
What do Power BI Visual Calculations do?
Through Power BI training, you can make the most of this feature and get tips on how to do the following:
Apply mathematical operations directly on visual elements like charts and tables.
Create quick aggregations, ratios, and comparisons without altering the data model.
Reduce reliance on DAX by allowing calculations to be embedded within visuals.
Enhance interactivity by making calculations context-aware and responsive to filters and slicers.
This feature streamlines analysis by letting users manipulate data visually, making insights more accessible to non-technical users.
How to use visual calculations in Power BI
You can learn how to use Visual Calculations in Power BI through training with Lumify Work.
Select a visual (e.g., bar chart, matrix, or table).
Open the visual’s settings pane and locate the “Visual Calculations” section.
Choose from predefined operations (e.g., percentage change, running total) or define a custom calculation using simple expressions.
Apply the calculation and observe the result directly in the visual - no need to create a new measure or column.
Bonus: Find out why Enterprise ICT Teams benefit from Power BI training.
How to enable Visual Calculations in Power BI
You can follow these steps to set up and configure Visual Calculations:
Ensure you’re using the latest version of Power BI Desktop or Power BI Service (June 2025 or later).
Go to Options > Preview Features and enable “Visual Calculations” if not already active.
Restart Power BI to apply changes.
In your report, select a visual and right click to access the “Visual Calculations” menu.
Define your calculation and customise its formatting as needed.
No additional setup is required in the data model, making it a lightweight and flexible tool for fast insights.

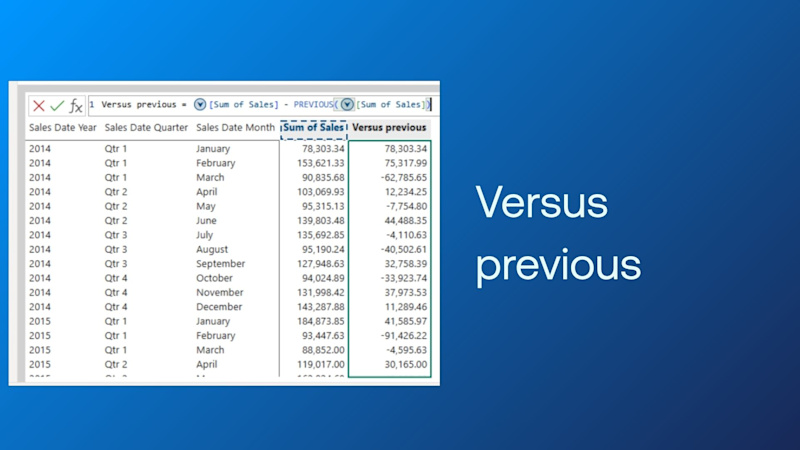
For the example below, I have used “Verses Previous” which calculates the difference from the previous month.
Learn about Visual Calculations with Power BI training courses
You can book and attend any of the following Microsoft Power BI training courses to learn how to format visual calculations in Power BI.
Entry-level workshops for professionals are available like Power BI Fundamentals.
There are also 1-day workshops with specific focus areas. Examples include Power BI Dashboard In a Day (DIAD), Power BI Administrator in a Day (IAD), Power BI Paginated Reports in a Day (IAD), Advanced Data Modelling and Shaping with Power BI (IAD), Data Visualisation with Power BI (IAD) and Power BI DAX in a Day (IAD).
Finally, there's PL-300T00 Design and Manage Analytics Solutions Using Power BI (PL-300 Exam Prep). This Power BI training course is designed for those who want to create actionable insights. It’s also ideal for those who visualise data from on-prem or cloud-based platforms, and professionals preparing for the PL-300 exam.
Access Data Analytics training with Lumify Work
Lumify Work offers Data Analytics courses so your teams can become experts in using powerful technology tools to find critical insights within a plethora of information. Contact our team to enquire about the courses. Download the Data & Analytics eBook.
We have partnered with leading global vendors like Microsoft to offer training courses in Data Analytics and critical tools like Power BI. As part of Lumify Group, Lumify Work has skilled more people in Microsoft technologies than any other organisation in Australia and New Zealand. We have a partnership delivery model in the Philippines.
Our fully certified trainers utilise the latest authorised courseware to deliver globally recognised courses and certifications. We received the Microsoft MCT Superstars Award for FY24, which formally recognises us as having the highest quality Microsoft Certified Trainers in ANZ.
With Lumify Anywhere, you can complete Data Analytics courses from the comfort of your home, office, from one of our campuses – or wherever it suits you best.